D3: gráfico scatterplot Volver
Gráfico scatterplot
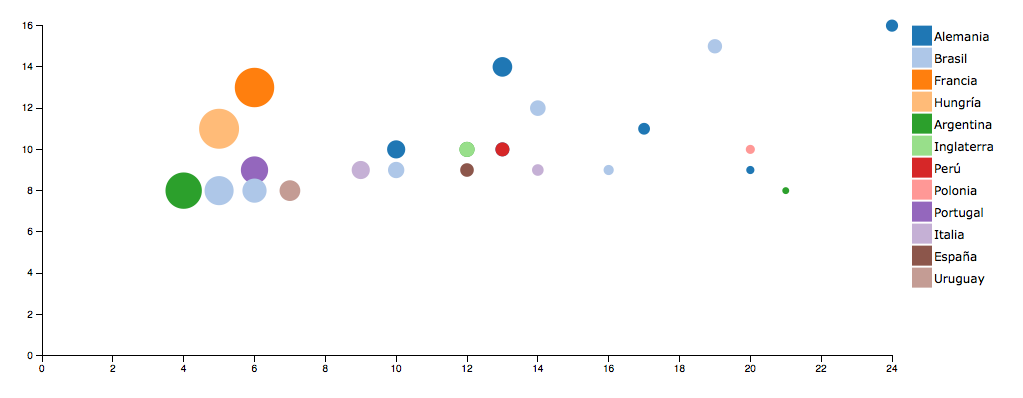
Actividad D3: Dada la información de los goleadores de los mundiales crear un gráfico scatterplot usando d3.js y CSS.
SVG
Definimos variables con tamaños y creamos el SVG
// Tamaños
var margin = {top: 20, right: 20, bottom: 150, left: 40},
    width = 960 - margin.left - margin.right,
    height = 500 - margin.top - margin.bottom;

// Crear SVG
var svg = d3.select("#chart").append("svg")
    .attr("width", width + margin.left + margin.right)
    .attr("height", height + margin.top + margin.bottom)
    .append("g")
    .attr("transform", "translate(" + margin.left + "," + margin.top + ")");
Máximos
Calcular el máximo de cada variable a utilizar.
//Máximos
var golesMax = d3.max(data,function(d){
      return d.goles;
    });
var partidosMax = d3.max(data,function(d){
    return d.partidos;
  });
Escalas
Setear las escalas para cada eje.
//Escalas
var x = d3.scale.linear()
  .domain([0,partidosMax])
    .range([0, width]);

var y = d3.scale.linear()
  .domain([0,golesMax])
    .range([height, 0]);
Ejes
Crear los ejes con las escalas y agregarlos al svg.
//Ejes
var xAxis = d3.svg.axis()
  .scale(x)
  .orient("bottom");

var yAxis = d3.svg.axis()
  .scale(y)
  .orient("left");

svg.append("g")
  .attr("class", "x axis")
  .attr("transform", "translate(0," + height + ")")
  .call(xAxis)

svg.append("g")
  .attr("class", "y axis")
  .call(yAxis);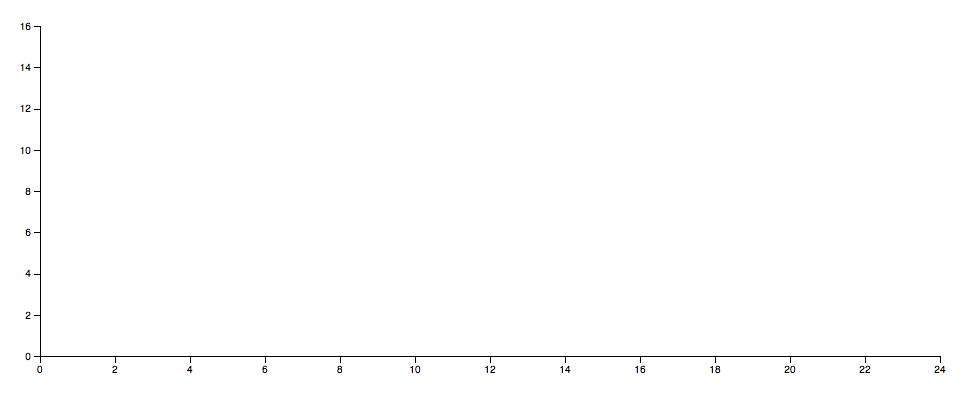
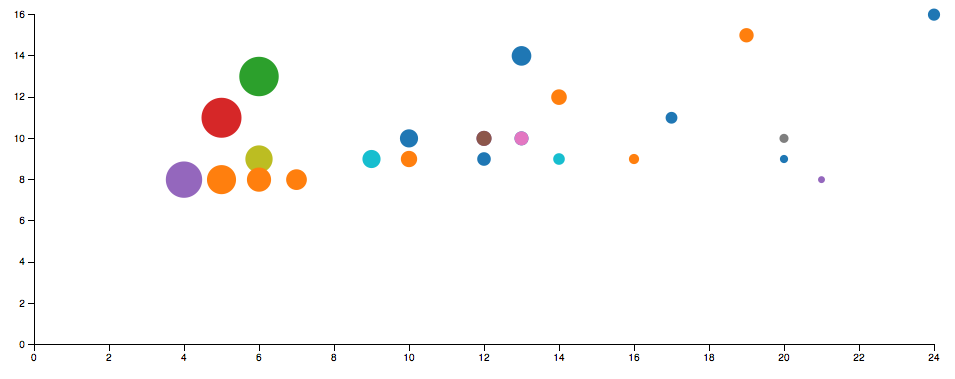
Círculos
Creamos los círculos y los ubicamos de acuerdo a las escalas
//Círculos
svg.selectAll(".circulos")
  .data(data)
  .enter()
  .append("circle")
  .attr("class", "circulos")
  .attr("cx", function(d) { return x(d.partidos); })
  .attr("cy", function(d) { return y(d.goles); })
  .attr("r", function(d) { return 20 });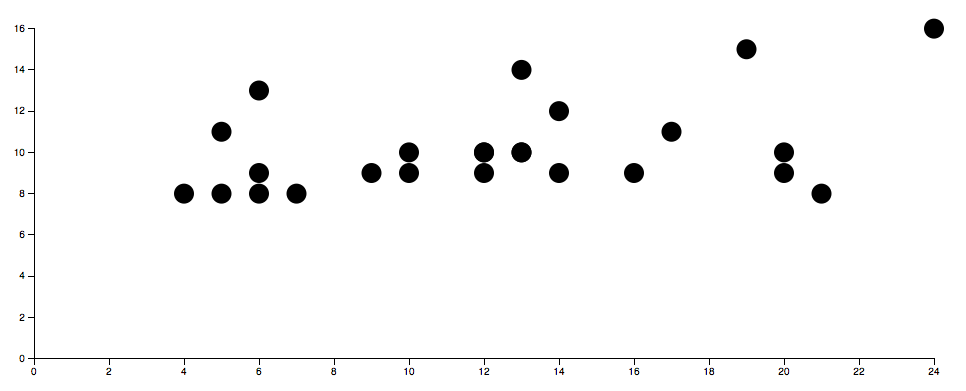
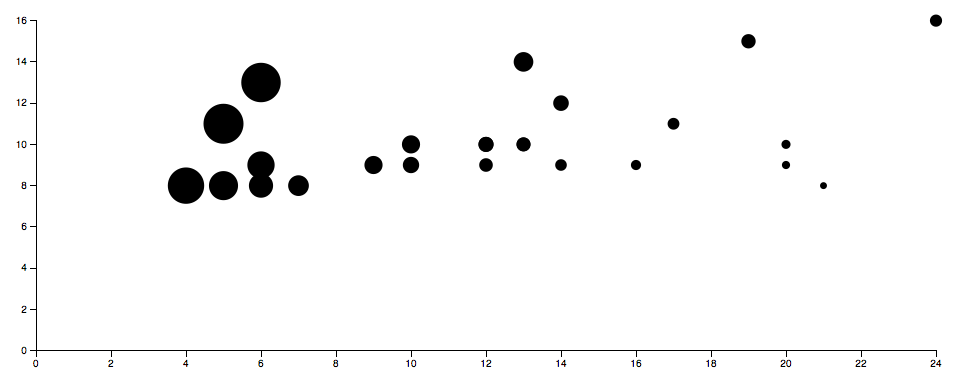
Escala para el radio
Calculamos máximo, creamos escala y aplicamos radio.
//Promedio máximo
var promedioMax = d3.max(data,function(d){
  return d.promedio;
});

//Escala para radio
var radio = d3.scale.linear()
  .domain([0,promedioMax])
  .range([0, 20]);

//Modifico el radio del círculo para que utilice la escala
//...
.attr("r", function(d) { return radio(d.promedio); });
Escala para el colores
Calculamos máximo, creamos escala y aplicamos radio.
//Creo la escala de colores
var color = d3.scale.category20();

//Agrego el color al círculo usando la escala basado en el equipo
//...
.style("fill", function(d) { return color(d.equipo);})
Legenda
Creamos la leyenda con el cuadrado y el nombre.
//Legend
var legend = svg.selectAll(".legend")
  .data(color.domain())
  .enter().append("g")
  .attr("class", "legend")
  .attr("transform", function(d, i) { return "translate("+(width+20)+"," + i * 22 + ")"; });

// draw legend colored rectangles
legend.append("rect")
  .attr("x", 0)
  .attr("width", 20)
  .attr("height", 20)
  .style("fill", color);

// draw legend text
legend.append("text")
  .attr("x", 22)
  .attr("y", 15)
  .text(function(d) { return d;})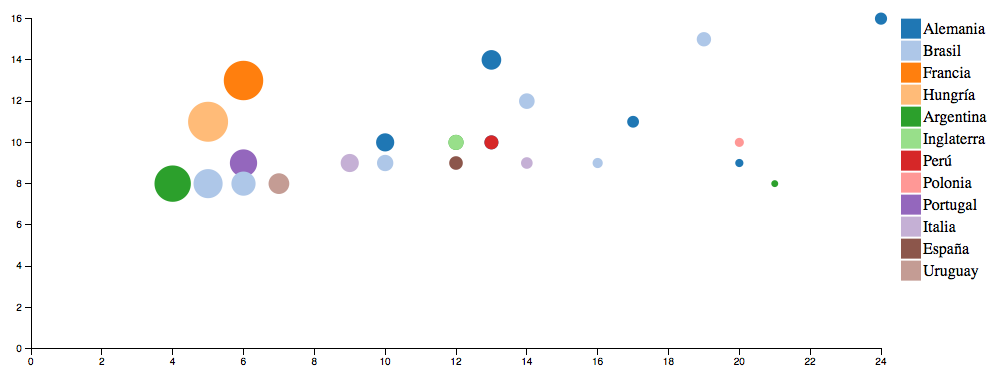
Agregamos acciones del mouse
Eventos sobre los círculos
.on("mouseenter", function(d){
  console.log('entra',d);
})
.on("mouseout", function(d){
  console.log('sale');
});
Creamos el círculo de selección animado
Un nuevo círculo, suelto en el svg que lo moveremos cuando sea pasemos por otro círculo.
//Círculo de selección
var seleccion = svg.append('circle')
  .attr("class", "seleccion")
  .attr('cx',0)
  .attr('cy',0)
  .attr('r',10)
  .style('fill','none')
  .style('stroke','black')
  .style('stroke-width',2);
Cambiamos ubicación, color y radio del círculo al hacer contacto con el mouse.
seleccion
        .attr('cx',x(d.partidos))
        .attr('cy',y(d.goles))
        .attr('r',radio(d.promedio)+4)
        .style('stroke',color(d.equipo));
Hacemos que aparezca apagado y se prenda cuando lo necestamos y se vuelva a apagar.
//invisible
.style('opacity',0);

//visible
.style('opacity',1);
Usamos transition para agrandarlo al momento del mouseenter y achicharlo en el mouseout
.on("mouseenter", function(d){
  seleccion
    .attr('cx',x(d.partidos))
    .attr('cy',y(d.goles))
    .attr('r',0)
    .style('stroke',color(d.equipo))
    .transition()
    .duration(500)
    .attr('r',radio(d.promedio)+4)
    .style('opacity',1);
})
.on("mouseout", function(d){
  seleccion
    .transition()
    .duration(200)
    .attr('r',0)
    .style('opacity',0);
});
Tooltip
Mostramos el nombre del jugador, cuando estemos por encima del círculo.
var seleccionTexto = svg.append('text')
    .attr("class", "seleccionTexto")
    .attr('x',0)
    .attr('y',0)
    .attr('text-anchor',"middle")
    .text('ejemplo de texto');
Creamos un texto suelto
En el mousenter lo ubicamos y le ponemos el texto del nombre.
Agregar estilo y color a gusto. :D
seleccionTexto
            .attr('x',x(d.partidos))
            .attr('y',y(d.goles)-radio(d.promedio)-5)
            .text(d.nombre);
Líneas
Sin más ayuda que la documentación, crear estas líneas que ayudan a identificar el valor en el eje.
Solución
¿Quedó algo parecido a Ver solución ?